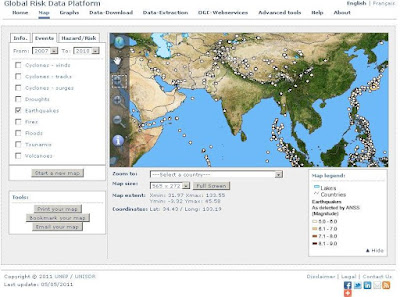
Global Risk Data Platform is a multiple agencies effort to share spatial data information on global risk from natural hazards. Users can visualise, download or extract data on past hazardous events, human & economical hazard exposure and risk from natural hazards. It covers tropical cyclones and related storm surges, drought, earthquakes, biomass fires, floods, landslides, tsunamis and volcanic eruptions. The collection of data is made via a wide range of partners (see About for data sources). This was developed as a support to the Global Assessment Report on Disaster Risk Reduction (GAR) and replace the previous PREVIEW platform already available since 2000. Many improvements were made on the data and on the application.
Tuesday, December 27, 2011
Thursday, December 22, 2011
Bhuvan Thematic Services Released
Bhuvan, ISRO's Geoportal and Gateway to Indian Earth Observation data products and services, now facilitates the users to select, browse and query the thematic data sets from this portal. Users can also consume these thematic data sets and integrate into their systems as OGC Web Services. Presently land use land cover (LULC) 50K : 2005-2006 datasets are available on the portal.
Friday, December 9, 2011
Satellite data from bhuvan is available for download
Satellite data from Bhuvan, a geoportal of ISRO (India’s answer to Google Earth) is available for download.
Users can download elevation data of CartoDEM-1arc second and Resourcesat-1: AWiFS data (56m) of Indian Region. Satellite earth observation data of Indian cities can also be accessed http://bhuvan-noeda.nrsc.gov.in/download/download/download.php
Monday, August 22, 2011
Landsat Time Enabled Imagery
View Larger Map
This map includes a variety of Landsat services which have been time enabled and can be explored using the Time Slider in the ArcGIS.COM Map Viewer or Explorer. Each layer has a predefined useful band combination already set on the services.
Data Source: This map includes image services compiled from the following Global Land Survey (GLS) datasets: GLS 2005, GLS 2000, GLS 1990, and GLS 1975. GLS datasets are created by the U.S. Geological Survey (USGS) and the National Aeronautics and Space Administration (NASA) using Landsat images. These global minimal-cloud cover, orthorectified Landsat data products support global assessments of land-cover, land cover-change, and ecosystem dynamics such as disturbance and vegetation health.
Hazards Map (Japan)
View Larger Map
This web map shows active hazards, including earthquakes and volcanoes, near Japan. The web map features a live map service of global active hazards from the Pacific Disaster Center.
The web map also includes a map notes layer showing the location of a few active events with links for more information. The map notes include the epicenter of the 9.0 magnitude earthquake and the location of the Fukushima nuclear plant that was damaged during the earthquake.
Glacier Retreat in Alaska
View Larger Map
The web map was built using Landsat Global Land Survey imagery made available by USGS and NASA. This web map features the false color/near infrared view of the Landsat imagery.
The Story of Seven Wonders of Ancient World
Monday, July 25, 2011
WDSSFI (Webbased Decision Support System for Infrastructure)
Tuesday, July 19, 2011
Utility Mapping for Decision Support System
The system basically developed for the decisions supports for particular company. It basically provides the rich GUI interface from which you can identify the low rise area, land-use, high rise areas etc.. It also provides the interface for dynamic querie generation.
 |
| Land Use |
 | |||
| Query Builder |
 |
| Map Browser |
Thursday, July 7, 2011
Geospatial Editor
"A Geospatial Editor contains a Digitizing Tools which help to create the vector data through web. Through Geospatial Editor you can add the new features easily in existing maps and also add the unclassified features. It provides you three methods for adding the spatial data (adding features) and it also provide you to add the non-spatial data related to that feature"
Snapshots
 |
| Geospatial Editor Interface |
 |
| Editing Example |
After working on open source technology I can conclude that it is boon for GIS user because as in the market there are various GIS Products are available but they are costly and also required many resources to use it. As using open source you can easily build a smart GIS products which required less resources and it’s cost would be also very less. And the work did by GIS user using proprietary GIS software it also easily done by open source GIS products
Wednesday, July 6, 2011
Subscribe to:
Comments (Atom)


